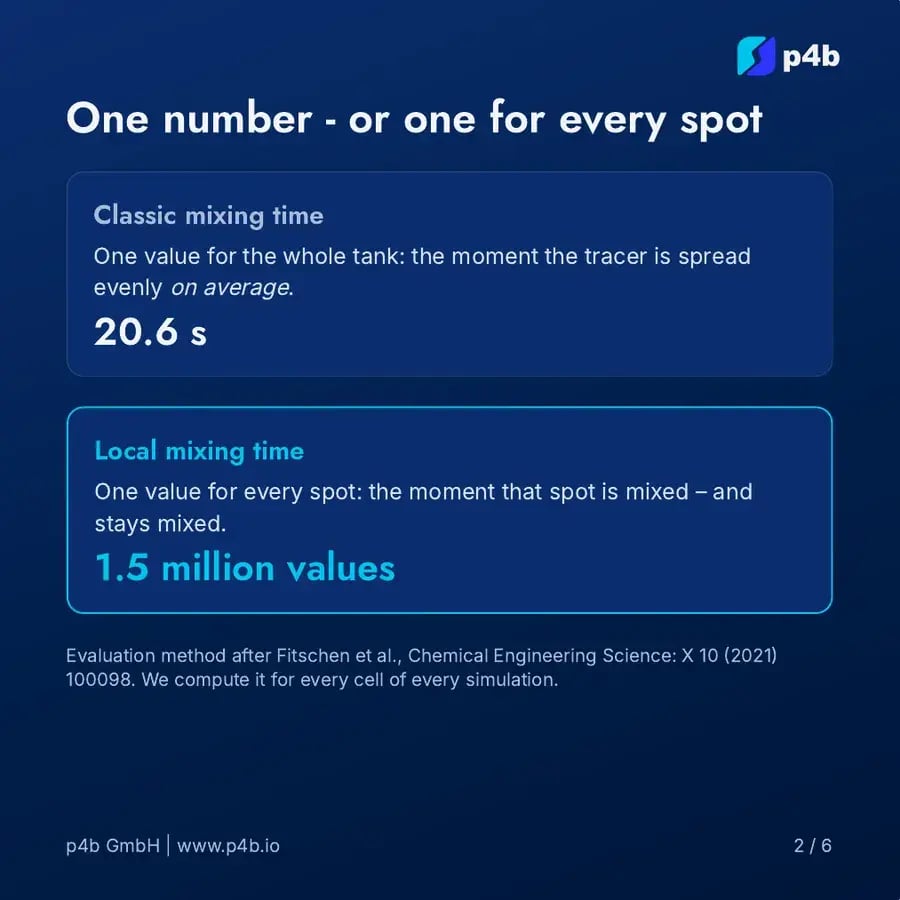
The classic mixing time is one value for the whole tank: the moment the tracer is spread evenly on average. In the vessel we looked at, that is 20.6 seconds. The liquid tells a different story.
The local mixing time gives one value for every spot: the moment that spot is mixed, and stays mixed. We compute it for every cell of every simulation, following the evaluation method of Fitschen et al. (Chemical Engineering Science: X 10 (2021) 100098). Here that is 1.5 million values instead of one.
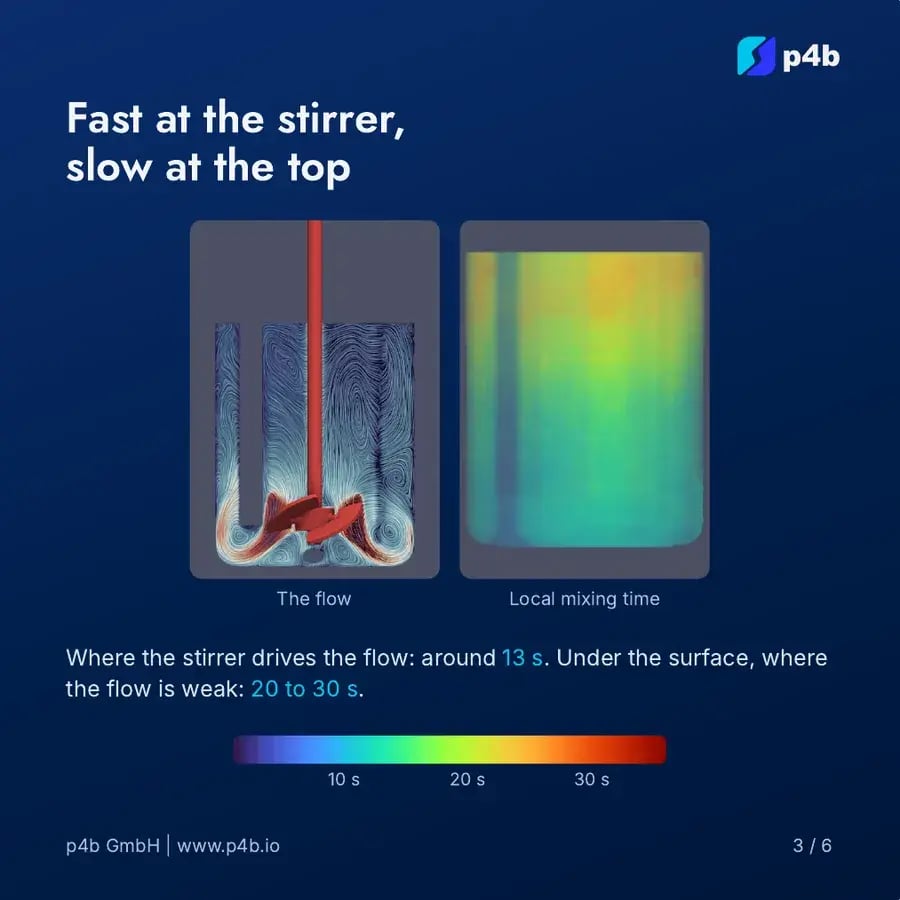
Where the stirrer drives the flow, the liquid mixes in around 13 seconds. Under the surface, where the flow is weak, it takes 20 to 30 seconds.
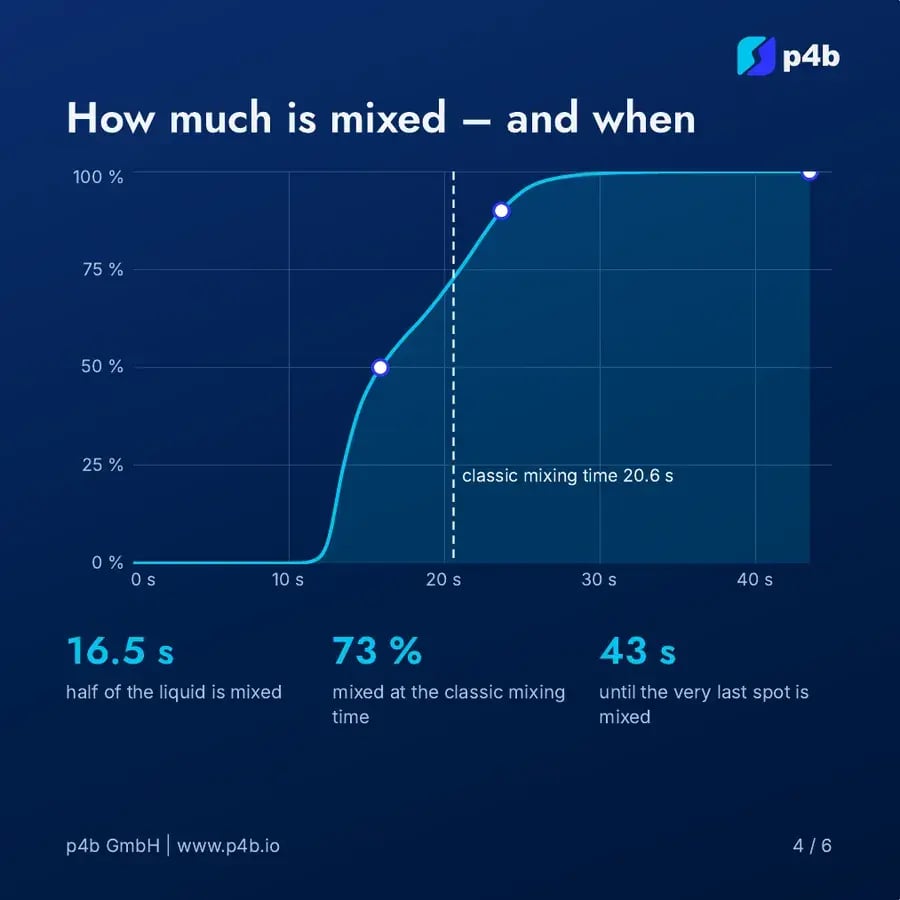
Looked at as a distribution: half of the liquid is mixed after 16.5 seconds, 73 % at the classic mixing time, and the very last spot only after 43 seconds.
Cells don't live in the average. Some of them live in the slow spots. In a large tank those slow zones grow, and with them the gradients in feed and oxygen that cells pass through. The local mixing time shows where they are, and what a scale-down model has to reproduce.
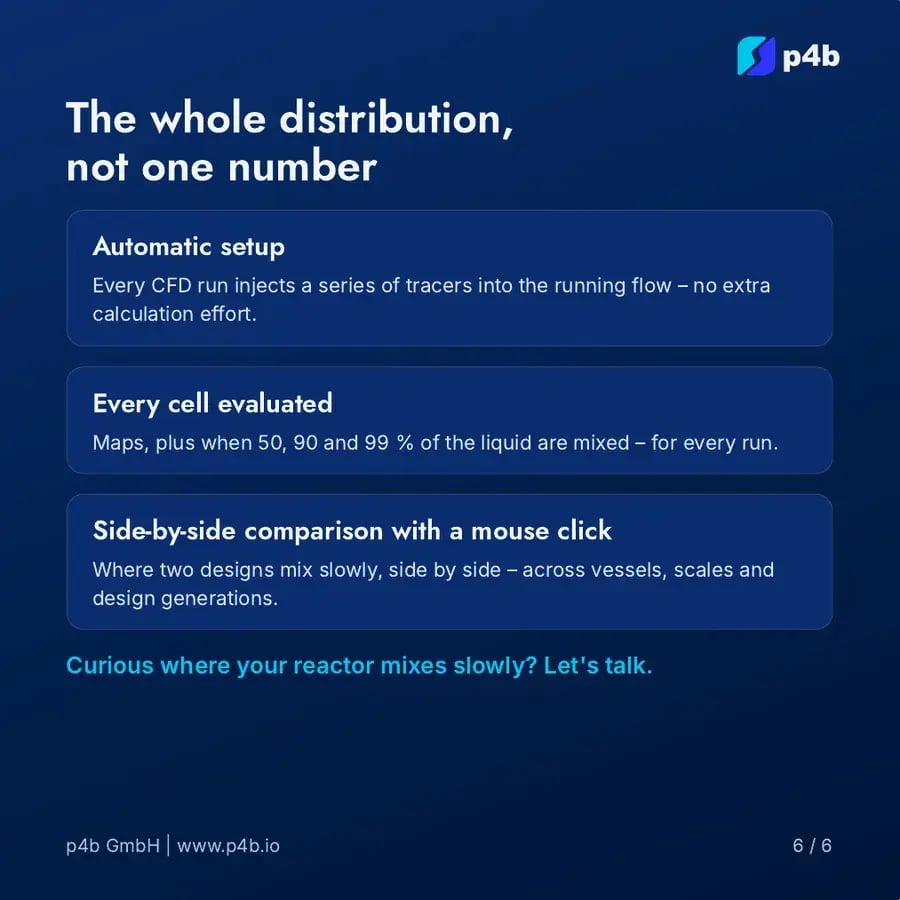
Every CFD run sets this up automatically: every cell is evaluated, with maps and the times at which 50, 90 and 99 % of the liquid are mixed. Two designs can be compared side by side - across vessels, scales and design generations.